Smart Traffic Control Map Set
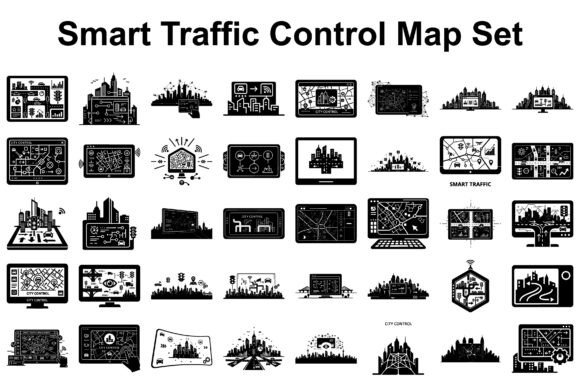
The Smart Traffic Control Map Set is not just another icon bundle—it’s a precision-crafted visual toolkit built for clarity, consistency, and real-world utility. With 200 total files—50 SVG, 50 PNG, 50 JPG, and 50 EPS—it delivers technical flexibility without sacrificing design integrity. Each file renders road networks, traffic flow patterns, smart intersections, navigation layouts, intelligent transport icons, and regulatory signage with clean lines, intentional spacing, and scalable geometry. That means what works at 24px in a mobile app interface also holds definition at 3 meters on a conference banner or laser-cut acrylic signage.
Why Strategic Clarity Matters More Than Visual Variety
Many teams default to assembling traffic visuals from fragmented sources: a free icon here, a stock map there, an outdated government PDF converted to JPEG. That approach introduces inconsistency—mismatched line weights, conflicting color logic, inconsistent scale—and quietly erodes credibility. The Smart Traffic Control Map Set solves that by offering a unified visual language. When your urban mobility presentation uses the same intersection silhouette in a slide deck, a printed stakeholder report, and an interactive web prototype, you’re not just saving time—you’re reinforcing coherence. That coherence supports trust, comprehension, and alignment—especially when explaining complex systems like adaptive signal timing or multimodal routing to non-technical decision-makers.
Use Cases That Deliver Measurable Outcomes
Consider how the Smart Traffic Control Map Set functions across distinct professional contexts:
- Educators use the silhouettes and flow diagrams to build modular lesson plans—overlaying real-time traffic data onto static SVG maps, then animating congestion patterns to teach cause-and-effect in transportation engineering.
- Urban planners embed EPS versions directly into GIS workflows or CAD environments, ensuring schematic diagrams retain vector fidelity when scaled or layered with geospatial data.
- Marketing teams repurpose navigation layouts as branded infographics for smart city proposals—pairing high-resolution JPGs with localized case studies to demonstrate scalability and implementation readiness.
- Freelance designers apply sublimation-optimized PNGs to apparel or exhibition materials for transportation conferences, turning abstract concepts like “V2X communication” into tactile, memorable visuals.
- Small business owners operating fleet logistics platforms integrate SVG icons into dashboards—ensuring responsive rendering across devices while maintaining brand-aligned stroke weights and corner radii.
What ties these uses together isn’t just convenience—it’s intentionality. Each file is structured to support a specific output need: SVG for interactivity and responsiveness, EPS for print production, PNG for transparency-sensitive digital displays, JPG for fast-loading web assets where color depth matters more than editability.
Planning Before Picking: Align Files With Purpose
Before downloading or deploying any element from the Smart Traffic Control Map Set, pause and ask: What outcome must this asset enable? If the goal is stakeholder buy-in for a new traffic management pilot, prioritize maps showing before/after flow comparisons—not isolated sign icons. If the goal is training material for municipal staff, select intersection variants that match local regulatory standards (e.g., roundabout vs. signalized T-junction), then annotate them with concise operational notes—not decorative flourishes.
Also consider workflow integration. An engineer using AutoCAD may rely heavily on EPS files for overlay accuracy but discard PNGs entirely. A blogger illustrating a post on congestion pricing will likely prefer SVGs they can recolor inline with CSS—avoiding unnecessary raster conversions. Knowing your toolchain—and its limits—prevents wasted effort and mismatched expectations.
Risks of Context-Free Use
Using the Smart Traffic Control Map Set without grounding it in purpose carries quiet but real risks. A beautifully rendered smart traffic system diagram loses impact if placed beside unrelated statistics without narrative framing. A high-resolution road sign icon becomes misleading if used outside its intended regulatory context—for example, applying a European-style yield symbol in a U.S.-focused safety guide without verification. Worse, indiscriminate reuse across projects dilutes visual distinction: if every client proposal uses the exact same intersection layout, your work begins to feel templated rather than tailored.
That’s why thoughtful curation matters more than volume. You don’t need all 50 SVGs for one project—you need the two or three that clarify the core idea without distraction. That discipline separates effective communication from visual noise.
Long-Term Value Beyond the Download
The Smart Traffic Control Map Set gains value over time—not because it’s updated quarterly, but because its design logic adapts. Its clean, minimal forms avoid stylistic trends (e.g., heavy shadows, exaggerated gradients) that date quickly. Its consistent grid-based construction makes custom modifications predictable: need to add a pedestrian crossing to an intersection? The base SVG’s anchor points and layer naming allow precise, non-destructive edits. Need to convert a flow map to grayscale for accessibility compliance? The vector structure preserves legibility far better than a flattened JPG.
This durability supports long-term branding continuity. A transit agency launching a multi-year smart infrastructure initiative can use the same icon set across annual reports, public engagement portals, and internal training—building recognition through repetition, not reinvention. For educators, it means creating reusable modules that remain relevant across curriculum revisions. For creators building digital products, it means reducing dependency on external asset libraries and increasing control over visual tone and technical performance.
How to Approach Integration Thoughtfully
Start small. Identify one recurring visual pain point—perhaps inconsistent map legends in your presentations or low-resolution signage in printed brochures—and replace it with a single, well-chosen file from the Smart Traffic Control Map Set. Test it in context: does it improve readability? Does it load faster? Does it align with your existing color system? Document what works—and what doesn’t—before scaling usage.
Then expand deliberately. Create a lightweight internal style guide: note which file types serve which outputs (e.g., “SVG for interactive prototypes,” “EPS for large-format printing”), list approved color overrides, and flag any symbols requiring jurisdictional verification. This isn’t bureaucracy—it’s infrastructure for consistency.
Finally, treat the set as a foundation—not a finish line. Its value multiplies when paired with original data, localized insights, or human-centered storytelling. A smart traffic flow map gains meaning only when anchored to real conditions: peak-hour bottlenecks, modal shift targets, equity metrics. The Smart Traffic Control Map Set gives you the visual grammar; your expertise supplies the syntax and semantics.
What to Consider Before Committing Resources
If you’re evaluating whether this set fits your needs, reflect on three practical realities:
- Your output mix. Do you regularly produce both digital and print deliverables? If yes, the inclusion of EPS and SVG ensures coverage. If you work exclusively in web-based tools with no vector editing capability, PNG and JPG may suffice—but verify resolution requirements for your largest display contexts.
- Your audience’s technical literacy. Highly technical stakeholders often respond better to simplified schematics (e.g., node-and-link traffic flow maps) than photorealistic renderings. The Smart Traffic Control Map Set leans into abstraction precisely to support that clarity.
- Your capacity for customization. While all files are editable, SVG and EPS require vector-aware software. If your team lacks access to Illustrator, Affinity Designer, or Inkscape, prioritize PNG/JPG variants and plan for simple overlays or annotations instead of deep structural edits.
There’s no universal “best” way to use the Smart Traffic Control Map Set. There is, however, a consistently effective way: match each file to a defined objective, validate it against real constraints, and measure its contribution—not by how many you use, but by how clearly it advances understanding.